
Capability 1
A coherent demonstration of global-to-local laboratory monitoring in Power BI.
Independent portfolio analysis
An interactive monitoring concept for comparing isotope concentration, temperature, pH, and measurement context across laboratories, regions, and time periods.
Sector context
Scientific and environmental monitoring
Role
Independent dashboard design and development
Format
Interactive Power BI monitoring view
Data
Representative demonstration measurements
The problem
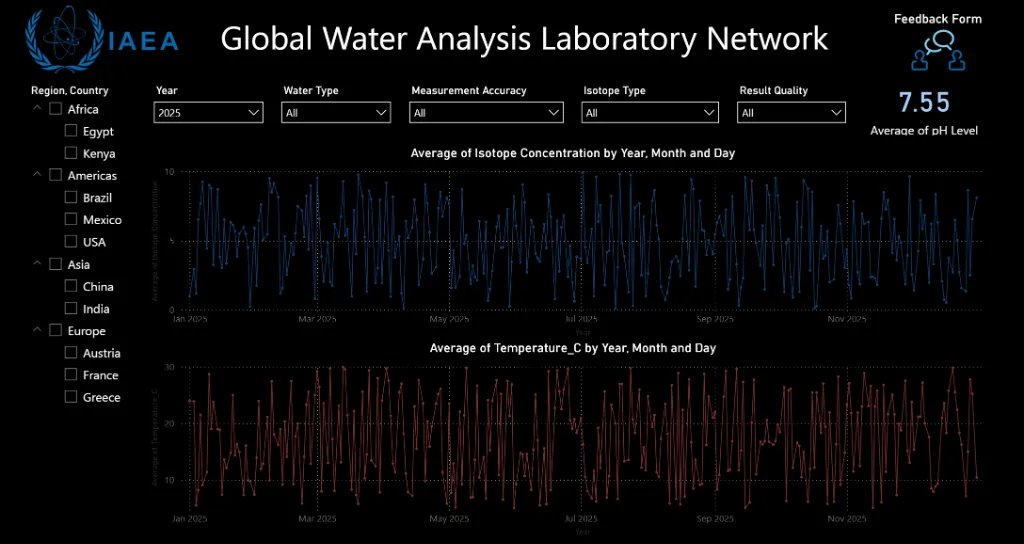
Scientific monitoring data becomes difficult to compare when laboratories, geographies, dates, water types, and measurement dimensions all need to remain visible. The portfolio brief was to create a compact view that supports both global scanning and specific comparisons.
Constraints
Approach
Organized the interface around comparison dimensions that a scientific user would repeatedly change.
Paired filterable time-series charts with current summary measures for faster orientation.
Kept region and country selection explicit so global patterns remain connected to local observations.
Delivered
Outcome
Because this is an independent demonstration rather than a client engagement, outcomes are described as delivered capabilities—not invented performance metrics.
Capability 1
A coherent demonstration of global-to-local laboratory monitoring in Power BI.
Capability 2
Comparable views across location, time, water type, and measurement context.
Capability 3
A reusable reporting pattern for environmental, scientific, and quality-control datasets.
Public evidence
The public project notes document the filters, measurements, representative-data status, and interactive demonstration.
View the project notes on GitHubRelated service
Explore the service behind dashboard strategy, semantic models, KPI definitions, access, governance, and Power BI delivery.
Explore the related serviceYour project
Share the users, data, and reporting problem. The first step is to define what a useful, maintainable result should be.
Change or withdraw permission using Cookie settings. Changing an existing choice may reload the page. Privacy Policy