
Capability 1
The published project account describes a centralized view of worker availability, scheduled work, assigned hours, remaining workload, project details, and refresh status.
Client project · Public delivery account
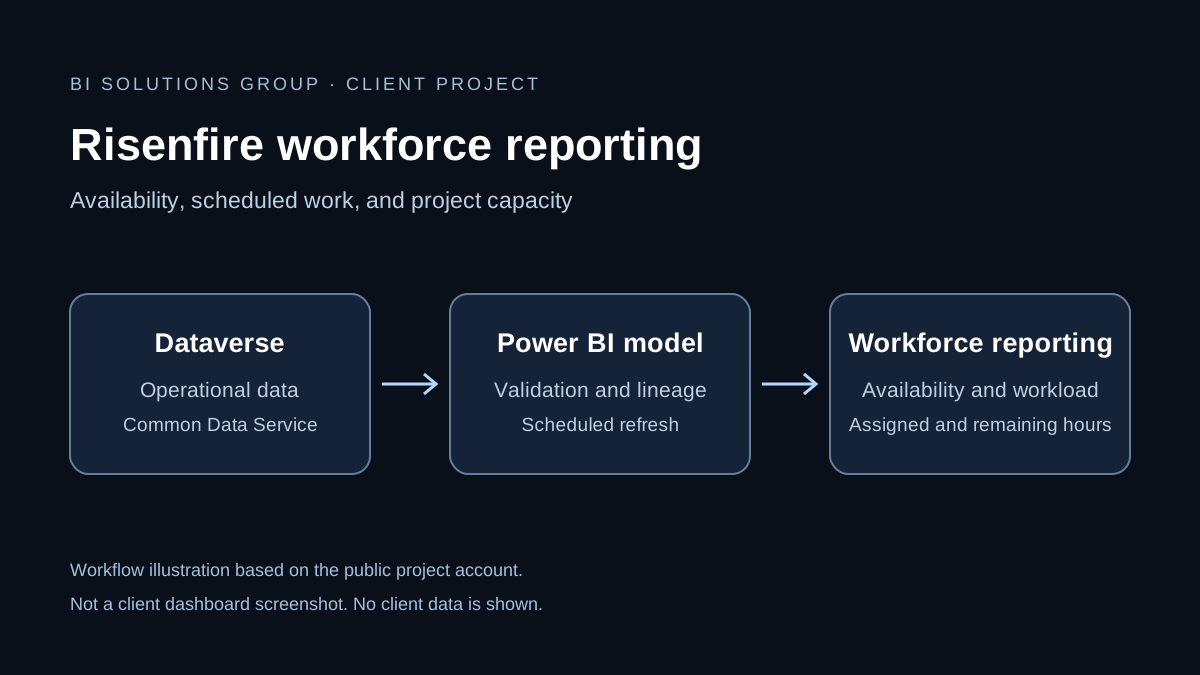
A Power BI workload and availability dashboard connecting operational data from Common Data Service / Dataverse to a centralized reporting layer for team capacity, scheduled work, and project workload.
Client
Risenfire · Orangeville, Ontario
Sector context
Fire safety and suppression
Platform
Power BI Service and Dataverse
Reporting focus
Worker availability and project capacity
The problem
Risenfire needed a clearer view of who was booked, who had hours available, and where the workload was coming from. The project addressed an HR analytics and workload-management challenge, with the goal of replacing manual tracking with a refreshed reporting process.
Constraints
Approach
Designed the Power BI semantic model and connected Common Data Service / Dataverse as the backend data source.
Worked on database management and data validation, scheduled refresh configuration, and Power BI Service lineage review.
Organized worker availability, capacity, scheduled planned work, assigned hours, remaining workload, and project details into a centralized reporting layer.
Delivered
Outcome
This client project account documents delivered capabilities using already public information. Quantified business results have not been published.
Capability 1
The published project account describes a centralized view of worker availability, scheduled work, assigned hours, remaining workload, project details, and refresh status.
Capability 2
The intended operational benefit was to replace manual tracking with refreshed reporting. Time savings, financial returns, and adoption results have not been quantified in this public account.
Public evidence
The founder's public LinkedIn post shares the BI Solutions Group delivery account. It is a first-party account of the project, rather than an independent review or a public dashboard.
Read the public project accountRelated service
Explore the service behind dashboard strategy, semantic models, KPI definitions, access, governance, and Power BI delivery.
Explore the related serviceYour project
Share the users, data, and reporting problem. The first step is to define what a useful, maintainable result should be.
Change or withdraw permission using Cookie settings. Changing an existing choice may reload the page. Privacy Policy