
Capability 1
A single demonstration flow for moving from portfolio-level audit status to country-office detail.
Independent portfolio analysis
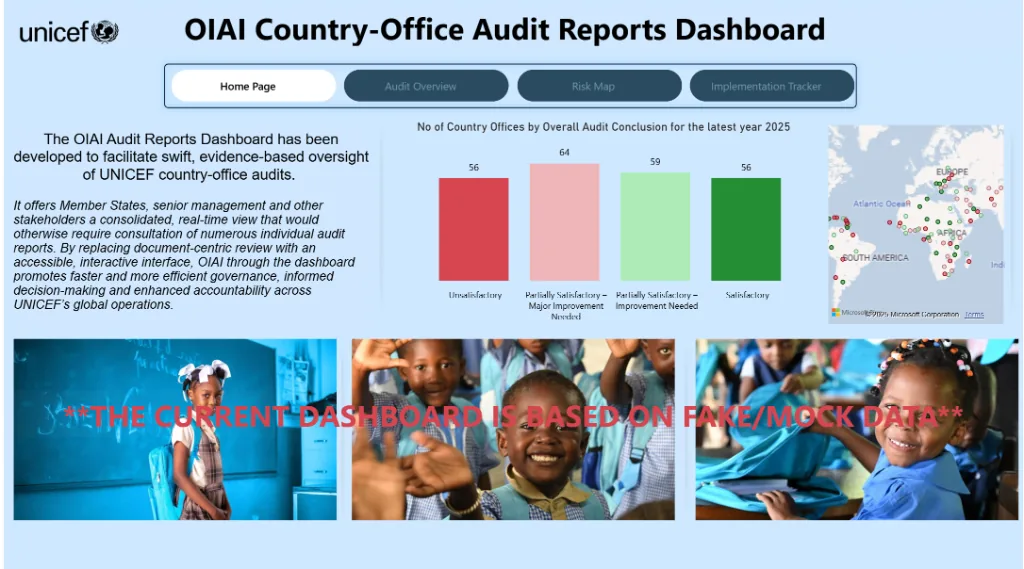
A four-page Power BI demonstration that brings audit ratings, country risk, expenditure, and recommendation implementation into one navigable reporting experience.
Sector context
International development and audit
Role
Independent dashboard design and development
Format
Four-page interactive Power BI report
Data
Synthetic demonstration dataset
The problem
Country-office audit reporting spans several audiences and questions: where risk is concentrated, how audit ratings vary, and whether recommendations are being implemented. The portfolio brief was to make those questions explorable without losing the detail behind each office.
Constraints
Approach
Started with the decisions each audience would need to make, then separated overview, risk, and implementation views.
Used consistent year, status, and observation-group filters so questions can carry across report pages.
Connected map views with detailed tables to keep geographic patterns traceable to underlying records.
Delivered
Outcome
Because this is an independent demonstration rather than a client engagement, outcomes are described as delivered capabilities—not invented performance metrics.
Capability 1
A single demonstration flow for moving from portfolio-level audit status to country-office detail.
Capability 2
Clear separation between audit outcomes, mapped risk, and recommendation follow-through.
Capability 3
A reusable example of how Power BI can support governance and compliance reporting.
Public evidence
The public project notes document the report pages, filters, mock-data status, and interactive demonstration.
View the project notes on GitHubRelated service
Explore the service behind dashboard strategy, semantic models, KPI definitions, access, governance, and Power BI delivery.
Explore the related serviceYour project
Share the users, data, and reporting problem. The first step is to define what a useful, maintainable result should be.
Change or withdraw permission using Cookie settings. Changing an existing choice may reload the page. Privacy Policy